Iron-Carbon Diagram Explanation [PDF]
In the last session, we had learned Different Types of steels, Methods for Manufacturing of Steel & Mechanical Properties of Metals whereas in today's session, we are going to discuss Iron- Carbon Phase Diagram with four Phase Transformations.
What is Critical Concentration?
Carbon is added to iron as an interstitial inclusion to improve the strength of iron. The maximum solubility of Carbon(C) in Iron(Fe) is 6.67% called critical concentration.
What is Cementite?
If carbon is added to Iron, it produces Iron Carbide(Fe3C) phase which is hard and brittle also called Cementite.
Note:
In this article, I will be explaining all the important concepts which are either underlined or bolded are useful for all types of examinations. Compulsory, 2 marks will be given from this Iron-Carbon Diagram Theory in any exam.
Iron-Carbon Phase Diagram with Detailed Explanation:
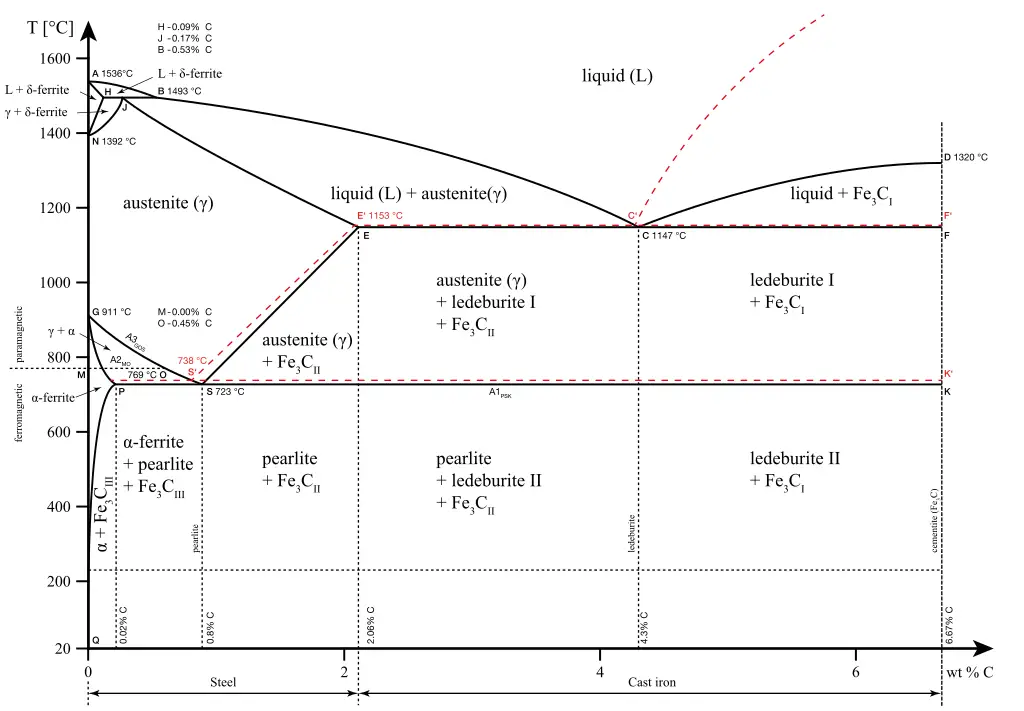
If the percentage of the carbon is in the range of 0 to 2.11 % then it is called Steel and if the percentage of carbon is in the range of 2.11 to 6.67% then it is called Cast iron.
As the carbon content increases, it produces more Iron-Carbide volume and that phase will exhibit high hardness.
What is a Phase Diagram?
Phase diagrams are graphical representations of the phases present in an alloy at different conditions of chemical composition, temperature, or pressure.
Iron-Carbon Phase Diagram-Phases:
The various phases of the Iron-Carbon Phase Diagram are as follows.
About γFe: (Gamma(γ)Iron)
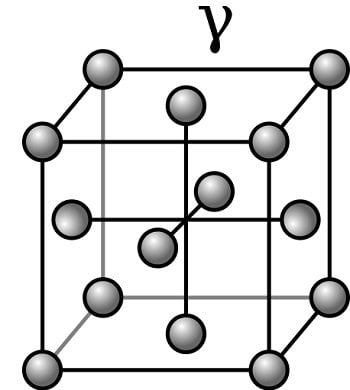
- γFe is also called as “Austenite”
- The maximum solubility of carbon is 2.11 % at 1147 degrees centigrade.
- By varying carbon content from 0 to 2.11 % variety of Steels in the γFe phase can be obtained.
- By heating or cooling process of γFe phase, the grain size can be modified(heat treatment) so that a variety of phases with different strengths can be obtained.
- The hardness of the γFe phase depends on the percentage of carbon that it possesses.
- The minimum temperature about which the γFe phase exists is 723-degree centigrade at 0.8 Percentage of Carbon.
- The structure is FCC.
About αFe: (Alpha(α) Iron)
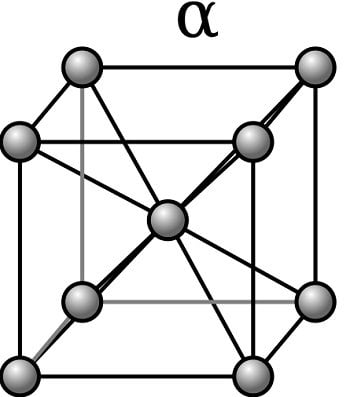
- αFe is also called as “Ferrite”.
- The maximum solubility of carbon is 0.025% at 723-degree centigrade.
- αFe possesses similar properties of pure iron but hardness is slightly high compared to pure Iron.
- It is magnetic.
- The structure is BCC.
About δFe: (Delta(δ) Iron)
The maximum solubility of carbon is 0.1% at 1493 degrees centigrade.
- Fe(δ-Iron) possesses very low carbon content and thereby it possesses low hardness and that indicates it is a highly ductile phase.
- Fe is difficult to produce and the most unstable phase because the addition of very small carbon content in Iron(Fe) lattice with uniform distribution is very difficult at high temperatures.
- The structure is BCC.
Phase Transformation in Iron Carbon Diagram:
The four Phase Transformations in Fe-C Diagram are as follows.
- Eutectoid Phase Transformation
- Eutectic Phase Transformation
- Peritectic Phase Transformation
- Peritectoid Phase Transformation
The Detailed Explanation of all the above phases is presented below.
Eutectoid Phase Transformation:
The Eutectoid Phase Transformation is as follows.
At ‘S’ point: (Eutectoid Point)
S1--> [S2 + S3]
γFe-->[(αFe) + Fe3C] at 0.8%C @723 Degree Centigrade
Note: (αFe) + Fe3C is called as Pearlite.
What is a Pearlite?
In the Iron-Carbon Diagram, the austenite phase(γFe) can undergo a Eutectoid transformation to produce ferrite and cementite called as Pearlite.
Eutectic Phase Transformation:
The Eutectic Phase Transformation is as follows.
At ‘C’ point:(Eutectic Point)
L (Fe+C)--> [(γFe) + Fe3C] at 4.3%C @1147 Degrees Centigrade
L--> [S2 + S3]
A eutectic reaction is a three-phase reaction, by which on cooling, a liquid transforms into two solid phases at the same time.
Peritectic Phase Transformation:
The Peritectic Phase Transformation is as follows.
At ‘J’ point:(Peritectic Point)
(δFe+ L)--> (γFe) at 0.17%C @1493 Degree Centigrade
(S1+L )-->S2
Peritectoid Phase Transformation:
The Peritectoid Phase Transformation is as follows.
(S1+S2 )-->S3
Note:
A mixed-phase of (γFe + Fe3C) existing from 4.3% to 6.67% between 723 Degree Centigrade to 1145 Degree Centigrade is known as Ledeburate Phase.
Why Cast Iron(C.I) is not Heat Treatable?
- Maximum percentage of carbon that steel can be produced is 1.5 % only.
- If the carbon content is 2.11 to 6.67%, above the liquidus line, it exists in the form of molten liquid and below the liquidus line, it exists as a solid.
- The maximum percentage of carbon in cast iron can be produced is 5% only because in GE2H region, the melting point is minimum and that implies obtaining molten liquid is easy and thereby casting process is also easy.
- By the addition of alloying elements, the properties of cast iron cannot be improved effectively because the carbon content is very high.
- By either heating or cooling process, modification of grain size in cast iron is difficult because it causes more volume of Iron carbide(Fe3C) and that implies a modification of bonds among the atoms is difficult and that implies Changing of grain size is difficult and hence Cast Iron(C.I) is not heat treatable.
A Complete Video Lecture on Iron carbon Phase Diagram:
FAQs:
What is Cementite?
What is a Phase Diagram?
What is a Pearlite?
So this is the detailed explanation of the Iron Carbon Phase Diagram which was explained successfully with the help of important points in bolded and underlined text. If you have any doubts w.r.t. the Iron-Carbon Diagram Theory, you can ask us in the comments section.
More Resources:
Mechanical Properties of Metals
Non-Ferrous Metals
Macroscopic and Microscopic Properties
References [External Links]:
- Iron-Carbon Phase Diagram - University of Tennessee
- Phase Diagrams - Nptel